
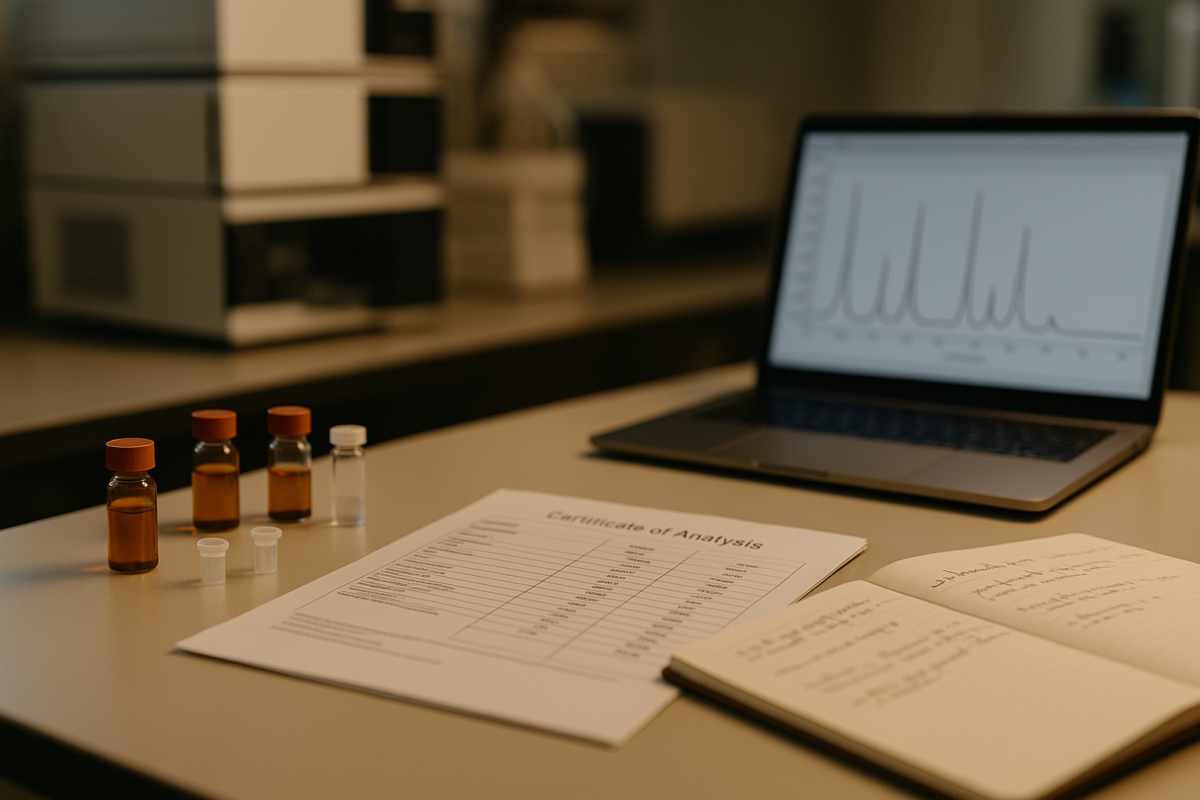
Comparing COA results across batches is a routine but technically nuanced activity in laboratory research and quality control. Researchers who compare COA results across batches should differentiate true manufacturing or material differences from analytical variability, document method provenance, and apply appropriate statistical and practical checks. This article outlines a systematic approach to cross-batch COA review grounded in regulators’ guidance and peer-reviewed literature.
What a COA typically reports
A certificate of analysis (COA) or peptide COA usually presents identity tests, purity/assay values, related-substance or impurity profiles, water content, residual solvents, and microbial or endotoxin results where relevant. COAs may also reference the analytical methods (e.g., HPLC, LC-MS, GC) and acceptance criteria used by the testing laboratory. When reviewing COAs across batches, start by listing which attributes are reported and which analytical methods were used.
Step 1 — Verify analytical method information
Analytical method validation determines the measurement uncertainty that influences whether numerical differences are meaningful. FDA guidance on analytical validation describes key parameters such as precision, accuracy, specificity, linearity, range, detection and quantitation limits, and robustness [FDA Q2(R1)]. When COAs cite validated methods, review the validation summary or method reference to understand expected variability before comparing batches.
Why method history matters
Method transfers, revalidations, or changes in reagents/instrumentation can cause systematic differences. Regulatory guidance recommends comparability or bridging studies when methods change; retention samples and documentation of method changes make retrospective comparisons more reliable [FDA Analytical Procedures and Methods Validation guidance].
Step 2 — Check raw data and integration rules
Don’t rely solely on summary numbers. When possible, review raw chromatograms, mass spectra, calibration curves, and integration parameters. Differences in peak integration rules, smoothing, or baseline selection can alter reported assay or impurity percentages without any change in the material itself. Documentation of data processing rules supports reproducible comparisons.
Step 3 — Choose appropriate statistical and graphical tools
Several statistical approaches can be used to assess agreement or bias across lots. The choice should match the question (e.g., equivalence vs. difference) and the available data.
Common tools and their uses
- Bland–Altman plots: visualize agreement and bias between paired measurements and highlight proportional differences.
- Passing–Bablok or Deming regression: evaluate proportional or constant bias when measurements arise from different methods or instruments.
- Equivalence testing (e.g., 90% confidence interval on ratios): used in lot-to-lot equivalence framing in manufacturing contexts.
- Control charts and process capability analyses: monitor ongoing intra-batch and inter-batch variability over time.
Peer-reviewed literature on lot-to-lot evaluation and sample-size planning emphasizes that required sample numbers depend on intra- and inter-batch variability and on the predefined acceptance margins [PMC7760601].
Step 4 — Define acceptance criteria and documentation
Acceptance criteria should be scientifically justified. ICH Q6A discusses how quantitative acceptance ranges are established and how inter-batch variability should inform specification limits. A common starting point in many contexts is a narrow percentage range around a label claim, but that range must be justified by historical performance, analytical method capability, and regulatory expectations.
Document the rationale for any criterion used in comparisons, including the source of limits (historical data, regulatory guidance, or analytical validation results) and the statistical approach used to make decisions.
Step 5 — Practical sampling and troubleshooting
Design comparisons so samples span the analytical range reported on COAs and minimize time between paired measurements when possible. If a single COA value appears as an outlier, repeat testing, review QC charts, and examine storage and shipping records before concluding a true batch difference. Retention samples can enable repeat or orthogonal testing when discrepancies emerge [FDA Analytical Procedures guidance].
Interpreting small numerical differences
Small numerical differences between COAs (for example, a few percentage points in an assay or minor shifts in impurity profile) may reflect analytical uncertainty rather than a substantive material change. Use method precision estimates and historical control data to determine whether observed differences exceed expected analytical variation.
When to use orthogonal methods
Orthogonal testing (e.g., confirming an HPLC result with MS or a different column chemistry) can clarify whether differences are analytical artifacts or reflect real compositional change. Regulatory guidance encourages orthogonal or complementary methods when identity or impurity questions cannot be resolved by a single technique [FDA Q2(R1)].
Recordkeeping and traceability
Maintain COA copies, raw data files, instrument logs, calibration records, and any comparability study reports. Traceability supports reproducible decision-making and is consistent with expectations in regulatory guidance such as ICH Q6A and FDA method-lifecycle documents.
Limitations and research-only framing
This article focuses on laboratory-research and quality-control approaches for comparing COA data. It does not provide operational instructions for manufacturing changes, regulatory submissions, or product-use decisions. Researchers should interpret COA comparisons within the constraints of available data, documented analytical uncertainty, and validated method scope.
Key references
Selected guidance and literature useful for COA comparisons are provided in the references and external links below.
Research Sources
Primary references and source materials used for this research-focused overview:
- https://database.ich.org/sites/default/files/Q6A%20Guideline.pdf
- https://www.fda.gov/regulatory-information/search-fda-guidance-documents/q2r1-validation-analytical-procedures-text-and-methodology-guidance-industry
- https://www.fda.gov/files/drugs/published/Analytical-Procedures-and-Methods-Validation-for-Drugs-and-Biologics.pdf
- https://pmc.ncbi.nlm.nih.gov/articles/PMC7760601/
- https://pmc.ncbi.nlm.nih.gov/articles/PMC6223607/
Frequently Asked Questions
What is the first thing to check when COA values differ between batches?
Start by confirming the analytical method cited on each COA and reviewing method validation or change records. Differences in method, integration rules, or instrument configuration often explain small numerical discrepancies.
How can I tell whether a difference is analytical variability or a real batch difference?
Compare the observed difference to method precision and historical variability. Use statistical tools (e.g., Bland–Altman, control charts) and, if available, repeat testing or orthogonal methods to distinguish analytical artifacts from material changes.
Are there recommended statistical approaches for lot comparisons?
Yes. Bland–Altman plots, Passing–Bablok regression, equivalence testing with confidence intervals, and control-chart analyses are among commonly used methods. Choice depends on the data structure and whether the objective is to assess agreement, bias, or equivalence.
What documentation should accompany COA comparisons?
Keep COAs, raw chromatograms/spectra, calibration and QC records, method validation/transfer reports, and any comparability analyses. Clear documentation supports traceability and reproducibility of conclusions.